Advanced Drawing Tools
Advanced Custom Drawing Tools
Creating a Trend-Line Tool
Because we can do whatever we want with JavaScript, we have a huge amount of freedom when developing our own custom drawing tools. This allows us to use advanced math, place graphics arbitrarily, and even add tooltips that contain custom calculations. In this article, I'll demonstrate what we can accomplish with the Custom Drawing module by walking through the creation of a simple Trend-Line drawing tool.
Let's begin by building a template for our drawing tool:
const predef = require("./tools/predef")
const { px, du, op } = require("./tools/graphics")

const Trender = {

    render() {},

    tooltips() {},

    anchorRestraints() {},

    anchorStyles() {
        return [
            { color: props.lower },
            { color: props.lower },
            { color: props.upper }
        ]
    }
}

module.exports = {
    name: "Trender",
    description: "Trender",
    drawing: Trender,
    params: {
        upper: predef.paramSpecs.color('#2d2'),
        middle: predef.paramSpecs.color('#999'),
        lower: predef.paramSpecs.color('#d22')
    },
    maxN: 3
}
First, notice we've brought a few methods and objects into scope with require. We will need We can define the our drawing tool as a simple object. The Trender object contains the drawing implementation methods that we will need to utilize. We can then use that object as our drawing field in the module.exports portion of the file. Some other notable portions of the module.exports object include the params field, our user defined parameters, and maxN which lets us define how many anchors our tool can have. In this case we want three anchors, which I'll explain as we go on. We can begin filling out our drawing implementation methods at this point. For now, let's focus on the render method. We will start by rendering a simple line:
const Trender = {
    //...

    render({anchors, props}) {
        return {
            items: [
                {
                    tag: 'LineSegments',
                    key: 'lower',
                    lines: [
                        {
                            tag: 'Line',
                            a: anchors[0],
                            b: anchors[1]
                        }
                    ],
                    lineStyle: {
                        width: 2,
                        color: props.lower
                    }
                },
            ]
        }
    }

    //...
}
If we try this, it should produce a line from the first anchor to the second anchor in the props.lower color (which defaults to reddish). But what we really want are three lines - an upper line, a lower line, and a midpoint line. We can use the third anchor to determine the height of our trend channel. Let's add a top line based on the third anchor:
const Trender = {
    //...

    render({anchors, props}) {
        //represents the height of the channel, or zero before anchors[2] exists
        const upperDiff = anchors[2]
            ? anchors[2].y.value - anchors[0].y.value
            : 0

        return {
            items: [
                //...
                {
                    tag: 'LineSegments',
                    key: 'upper',
                    lines: [
                        {
                            tag: 'Line',
                            a: anchors[2]
                                ? {
                                    x: anchors[0].x,
                                    y: du(anchors[0].y.value + upperDiff)
                                }
                                : anchors[0],
                            b: anchors[2]
                                ? {
                                    x: anchors[1].x,
                                    y: du(anchors[1].y.value + upperDiff)
                                }
                                : anchors[0]
                        }
                    ],
                    lineStyle: {
                        width: 2,
                        color: props.upper
                    }
                }
            ]
        }
    }

    //...
}
Now we're getting somewhere. Notice that we've used ternary expressions to determine the a and b points for the line drawings. This is because trying to read the x or y fields of an anchor when it is null will produce an error and mess up how the drawing renders, and it allows us to default to the zeroth anchor before anchors[1] or anchors[2] exist. You'll notice this pattern of defaulting to a known existing value often. But we still want to have a midpoint line as well. We can use the same upperDiff again, divided in half, to find the midpoint line of our channel:
const Trender = {
    //...

    render({anchors, props}) {
        return {
            items: [
                //...
                {
                    tag: 'LineSegments',
                    key: 'middle',
                    lines: [
                        {
                            tag: 'Line',
                            a: anchors[2]
                                ? {
                                    x: anchors[0].x,
                                    y: du(anchors[0].y.value + upperDiff/2)
                                }
                                : anchors[0],
                            b: anchors[2]
                                ? {
                                    x: anchors[1].x,
                                    y: du(anchors[1].y.value + upperDiff/2)
                                }
                                : anchors[0]
                        }
                    ],
                    lineStyle: {
                        width: 2,
                        color: props.middle,
                        lineStyle: 3
                    },
                }
            ]
        }
    }

    //...
}
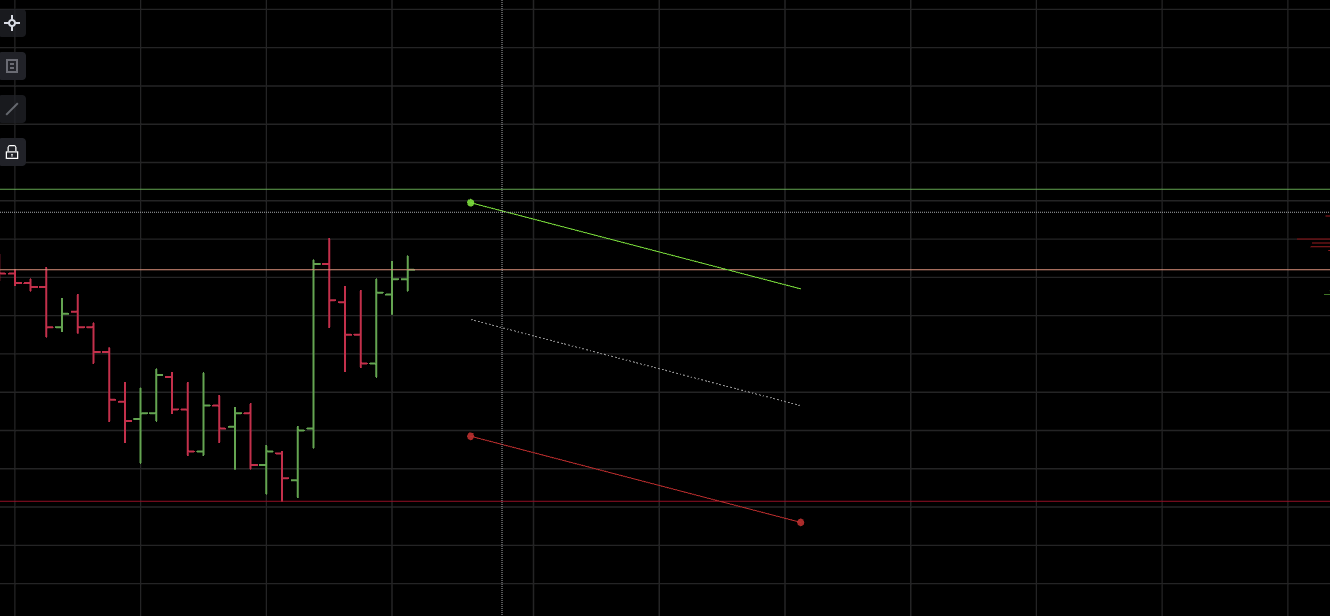
Our drawing is basically complete. You should have something that looks like this:
But when you hold SHIFT over this drawing, we get no information. That's because we haven't drawn any tooltips yet. Luckily, drawing tooltips is just as easy as defining a render function. Let's draw a tooltip for the price-point at anchors[0].
const Trender = {
    //...

    tooltips({anchors}) {

        return [
            {
                coord: anchors[0],
                alignment: {
                    tag: 'predef',
                    x: 'center',
                    y: 'below'
                },
                items: [
                    {
                        key: 'a0',
                        content: anchors[0].y.value
                    }
                ]
            },
        ]
    },

    //...
}
We should add a tooltip for the prices at each of the corners of our tool. Let's write another tooltip for anchors[1] that includes both the price-point, and the tick-delta between anchors[0] and anchors[1]. To get the tick delta, we'll need to track some differences between points that we have defined and their absolute values as well.
const Trender = {
    //...

    tooltips({anchors, props}) {
        //difference between anchors 0 and 1, and the absolute value of that difference
        const deltaARaw = anchors[1] ? anchors[0].y.value - anchors[1].y.value : 0,
              deltaA    = Math.abs(deltaARaw)

        return [
            //...
            {
                coord: anchors[1] || anchors[0],
                alignment: {
                    tag: 'predef',
                    x: 'right',
                    y: 'below'
                },
                items: [
                    //price-point
                    {
                        key: 'a1',
                        content: anchors[1] ? anchors[1].y.value : 0
                    },
                    //tick delta
                    {
                        title:
                            deltaARaw < 0 ? 'min. A to B Long: '
                        :   deltaARaw > 0 ? 'max. A to B Short: '
                        :                   ' - ',
                        key: 'lowerMin',
                        content: { delta: deltaA }
                    },
                ]
            },
        ]
    }

    //...
}
Notice that we have some runtime variance here. Based on whether the deltaARaw value is positive or negative, we will render different text based on what that price point and tick delta represent. In this case it is the point at anchors[1], so the lower right corner. This is either the minimum long value of the trend or the maximum short value of the trend.
In order to implement the midpoint and upper points, we will need a value for the vertical delta. Let's add that to our defined variables and add another tooltip for the midpoint price point and tick delta:
const Trender = {
    //...

    tooltips({anchors, props}) {
        const deltaARaw = anchors[1] ? anchors[0].y.value - anchors[1].y.value : 0,
              deltaBRaw = anchors[2] ? anchors[2].y.value - anchors[0].y.value : 0,
              deltaA    = Math.abs(deltaARaw),
              deltaB    = Math.abs(deltaBRaw)

        return [
            //...
            {
                coord:
                    anchors[1]
                    ? {
                        x: anchors[1].x,
                        y: du(anchors[1].y.value + deltaB/2)
                    }
                    : anchors[0],
                alignment: {
                    tag: 'predef',
                    x: 'right',
                    y: 'center'
                },
                items: [
                    {
                        key: 'a2.5',
                        content: anchors[1] ? anchors[1].y.value + deltaB/2 : 0
                    },
                    {
                        title:
                            deltaARaw < 0 ? 'avg. A to B Long: ~'
                        :   deltaARaw > 0 ? 'avg. A to B Short: ~'
                        :                   ' - ',
                        key: 'mid',
                        content:
                            deltaARaw > 0 ? { delta: deltaA - deltaB/2 }
                        :   deltaARaw < 0 ? { delta: deltaA + deltaB/2 }
                        :                   { delta: 0 }
                    },
                ]
            },
        ]
    }
}
We have to be a little creative about the coord field for the midpoint. I've used the du graphics helper function (which we required at the top of the file) to create the y coordinate. This is because all of the values we use must be ScaleBound values. These are simple objects which have both a unit field and a value field. We can construct them in a less verbose way by using du.
Note:
dustands for Domain Units. There is also thepxmethod which constructs ScaleBound values with the Pixels type unit.
We still need to finish filling out our tooltips. Let's finish them off by adding the top-left and top-right points.
const Trender = {
    //...

    tooltips({anchors, props}) {
        const deltaARaw = anchors[1] ? anchors[0].y.value - anchors[1].y.value : 0,
              deltaBRaw = anchors[2] ? anchors[2].y.value - anchors[0].y.value : 0,
              deltaA    = Math.abs(deltaARaw),
              deltaB    = Math.abs(deltaBRaw)

        return [
            //...
            //top left
            {
                coord:
                    anchors[1]
                    ? {
                        x: du(anchors[1].x.value),
                        y: du(anchors[1].y.value + deltaB)
                    }
                    : anchors[0],
                alignment: {
                    tag: 'predef',
                    x: 'right',
                    y: 'above'
                },
                items: [
                    //price
                    {
                        key: 'a1.5',
                        content: anchors[1] ? anchors[1].y.value + deltaB : 0
                    },
                    //delta
                    {
                        title:
                            deltaARaw < 0 ? 'max. A to B Long: '
                        :   deltaARaw > 0 ? 'min. A to B Short: '
                        :                   ' - ',
                        key: 'lowerMax',
                        content:
                            deltaARaw > 0 ? { delta: deltaA - deltaB }
                        :   deltaARaw < 0 ? { delta: deltaA + deltaB }
                        :                   { delta: 0 }
                    },
                ]
            },
            //top right
            {
                coord: anchors[2] ? { x: anchors[0].x, y: anchors[2].y } : anchors[0],
                alignment: {
                    tag: 'predef',
                    x: 'center',
                    y: 'above'
                },
                items: [
                    {
                        key: 'a2',
                        content: anchors[2] ? anchors[2].y.value : 0
                    }
                ]
            }
        ]
    }
}
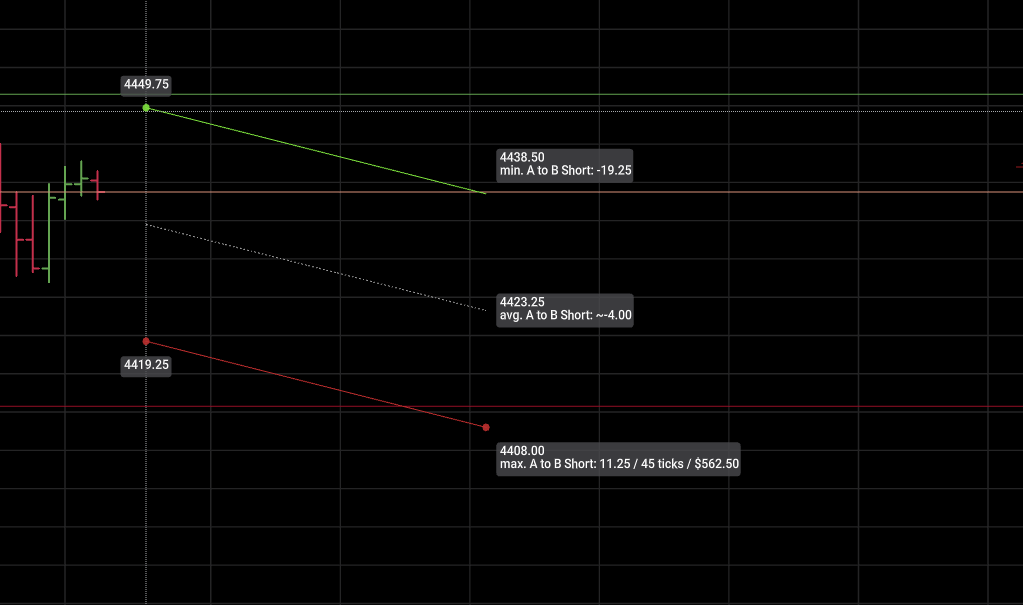
Now when we hold SHIFT over our drawing, we should see some actually useful information. Try it:
Generated using TypeDoc